Reproducibility in paediatric versus early adults’ groups
Contents
Reproducibility in paediatric versus early adults’ groups#
This notebook investigates whether different age stages (paediatric versus adults) have different reproducibility behaviour. The age range of the participants is from 6.5 to 56.2 years, and the analysis was carried out for two age groups: paediatric and adults. In this analysis the ABIDE I dataset was used. ABIDE I is a multi-site data sharing initiative (17 sites in total) with neurotypical controls and subjects diagnosed with Autism Spectrum Disorder (ASD).
#@title

import os
import math
import matplotlib
import numpy as np
import pandas as pd
import pingouin as pg
import scipy.stats
import seaborn as sns
import matplotlib.pyplot as plt
from collections import Counter

from sklearn.linear_model import LinearRegression
from utils import get_regression_metrics, bland_altman_plot
from settings import RESOURCE_DIR, ABIDE_MAP_SITES

# Tables format
#%matplotlib qt

pd.set_option('display.float_format', lambda x: f"{x: 0.2e}")

# Visualization format
font = {'size'   : 18}
matplotlib.rc('font', **font)
sns.set_theme(style="whitegrid", font_scale=2)

# Global variables
var_compare = "adult"
template_name = "a2009s"
metric_analysis = "corticalThicknessAverage"
path_csv_cortical_data = "cortical_thicknesss_paediatric_vs_early_adults_groups.csv"

color_pallete = {"ADULT": "#25654B", "PAEDIATRIC": "#C94444"}


var_analyse = ["r_square", "slope", "intercept"]

pipeline1 = "ACPC_CAT12"
pipeline2 = "FREESURFER"
/home/fmachado/anaconda3/envs/fs-cat12/lib/python3.9/site-packages/outdated/utils.py:14: OutdatedPackageWarning: The package pingouin is out of date. Your version is 0.5.1, the latest is 0.5.2.
Set the environment variable OUTDATED_IGNORE=1 to disable these warnings.
  return warn(
#@title

df_names_rois = pd.read_csv(os.path.join(RESOURCE_DIR, "template", f"{template_name}_atlas_labels.csv"))
df_areas = pd.read_csv(os.path.join(RESOURCE_DIR, "template", f"{template_name}_rois_areas.csv"))
Data#
#@title
df_software_raw = pd.read_csv(os.path.join(RESOURCE_DIR, "data", path_csv_cortical_data), low_memory=False)
df_software_raw.set_index("path", inplace=True)
# Get only the template ROIs
df_software_raw = df_software_raw.loc[df_software_raw.roiName.str[1:].isin(df_names_rois.label.to_list())]

df_software_raw.site = df_software_raw.site.apply(lambda x: ABIDE_MAP_SITES[x])
df_software_raw.head(4)
| repositoryName | site | adult | subjectID | sessionID | run | age | gender | software | roiName | corticalThicknessAverage | template | repository_and_site | cjv | cnr | snr_total | |
|---|---|---|---|---|---|---|---|---|---|---|---|---|---|---|---|---|
| path | ||||||||||||||||
| ABIDE_I/CaliforniaInstituteofTechnology/sub-0051475/anat/sub-0051475_T1w.nii.gz | ABIDE_I | California Institute of Technology | ADULT | sub-0051475 | 1 | 1 | 4.42e+01 | MALE | ACPC_CAT12 | lG_Ins_lg_and_S_cent_ins | 3.01e+00 | a2009s | ABIDE_I|CaliforniaInstituteofTechnology | 4.40e-01 | 3.16e+00 | 1.52e+01 |
| ABIDE_I/CaliforniaInstituteofTechnology/sub-0051475/anat/sub-0051475_T1w.nii.gz | ABIDE_I | California Institute of Technology | ADULT | sub-0051475 | 1 | 1 | 4.42e+01 | MALE | ACPC_CAT12 | lG_and_S_cingul-Ant | 3.11e+00 | a2009s | ABIDE_I|CaliforniaInstituteofTechnology | 4.40e-01 | 3.16e+00 | 1.52e+01 |
| ABIDE_I/CaliforniaInstituteofTechnology/sub-0051475/anat/sub-0051475_T1w.nii.gz | ABIDE_I | California Institute of Technology | ADULT | sub-0051475 | 1 | 1 | 4.42e+01 | MALE | ACPC_CAT12 | lG_and_S_cingul-Mid-Ant | 2.94e+00 | a2009s | ABIDE_I|CaliforniaInstituteofTechnology | 4.40e-01 | 3.16e+00 | 1.52e+01 |
| ABIDE_I/CaliforniaInstituteofTechnology/sub-0051475/anat/sub-0051475_T1w.nii.gz | ABIDE_I | California Institute of Technology | ADULT | sub-0051475 | 1 | 1 | 4.42e+01 | MALE | ACPC_CAT12 | lG_and_S_cingul-Mid-Post | 2.73e+00 | a2009s | ABIDE_I|CaliforniaInstituteofTechnology | 4.40e-01 | 3.16e+00 | 1.52e+01 |
Check preprocessing problems#
Some images were only ran by one of the softwares, in the code below images with preprocessing problems are discoved, and those subjects/session/run are removed from the analysis.
#@title
roi_name = df_software_raw.loc[(~df_software_raw[metric_analysis].isna()) & (df_software_raw.template == template_name)].roiName.to_list()[1]

df_group = df_software_raw[df_software_raw["roiName"] == roi_name].copy()
df_group = df_group[df_group.template == template_name].groupby(by=['path']).apply(lambda x: list(x["software"]))

# Get the images run by only one
df_problems_running = df_group[df_group.apply(len) == 1].to_frame()


software_problems = [item for sublist in df_problems_running[0].to_list() for item in sublist]


print("\n".join([f"{number_problems} images were only processed by: {soft_name}" for soft_name, number_problems in Counter(software_problems).items()]))
2 images were only processed by: ACPC_CAT12
3 images were only processed by: FREESURFER
Exclude the subjects only run by only one software#
#@title
df_software_raw = df_software_raw[~df_software_raw.index.isin(df_problems_running.index)]
Demographics#
#@title
df_subjects = df_software_raw[["repositoryName", "site", var_compare, "repository_and_site", "subjectID", "sessionID", "run", "age", "gender", "snr_total"]].drop_duplicates().copy()
df_subjects.site = df_subjects.site.apply(lambda x: "" if type(x)==float else x)

if len(df_subjects["repositoryName"].unique()) == 1:
    groupby_col = ["site"]
else:
    groupby_col = ["repositoryName", "site"]

df_summary = df_subjects.groupby(groupby_col).apply(lambda x: pd.Series({"Total of participants": len(x),
                                                                         "Number males": (x["gender"]=="MALE").sum(),
                                                                         "Mean and standard deviation [years]": f"{x['age'].mean(): 0.2f}+/-{x['age'].std(): 0.2f}",
                                                                         "Min Age [years]": f"{x['age'].min(): 0.2f}",
                                                                         "Max Age [years]": f"{x['age'].max(): 0.2f}"}))


df_summary
| Total of participants | Number males | Mean and standard deviation [years] | Min Age [years] | Max Age [years] | |
|---|---|---|---|---|---|
| site | |||||
| California Institute of Technology | 19 | 15 | 28.87+/- 11.21 | 17.00 | 56.20 |
| Carnegie Mellon University | 13 | 10 | 26.85+/- 5.74 | 20.00 | 40.00 |
| Kennedy Krieger Institute | 33 | 24 | 10.16+/- 1.26 | 8.07 | 12.77 |
| Ludwig Maximilians University Munich | 32 | 28 | 26.19+/- 9.96 | 7.00 | 48.00 |
| NYU Langone Medical Center | 104 | 78 | 15.83+/- 6.28 | 6.47 | 31.78 |
| Olin Institute of Living at Hartford Hospital | 16 | 14 | 16.94+/- 3.68 | 10.00 | 23.00 |
| Oregon Health and Science University | 15 | 15 | 10.06+/- 1.08 | 8.20 | 11.99 |
| San Diego State University | 22 | 16 | 14.22+/- 1.90 | 8.67 | 16.88 |
| Social Brain Lab | 15 | 15 | 33.73+/- 6.61 | 20.00 | 42.00 |
| Stanford University | 19 | 15 | 9.97+/- 1.64 | 7.75 | 12.43 |
| Trinity Centre for Health Sciences | 25 | 25 | 17.08+/- 3.77 | 12.04 | 25.66 |
| University of California Los Angeles | 45 | 39 | 12.96+/- 1.92 | 9.21 | 17.79 |
| University of Leuven | 35 | 30 | 18.17+/- 4.99 | 12.20 | 29.00 |
| University of Michigan | 75 | 58 | 14.82+/- 3.62 | 8.20 | 28.80 |
| University of Pittsburgh School of Medicine | 27 | 23 | 18.88+/- 6.64 | 9.44 | 33.24 |
| University of Utah School of Medicine | 43 | 43 | 21.36+/- 7.64 | 8.77 | 39.39 |
| Yale Child Study Center | 28 | 20 | 12.68+/- 2.75 | 7.66 | 17.83 |
#@title
df_software = df_software_raw.reset_index().pivot(['path',  'subjectID', 'sessionID', 'run', 'template', var_compare,'roiName'], ['software'], [metric_analysis]).reset_index().set_index("path")
df_software.head(4)
| subjectID | sessionID | run | template | adult | roiName | corticalThicknessAverage | ||
|---|---|---|---|---|---|---|---|---|
| software | ACPC_CAT12 | FREESURFER | ||||||
| path | ||||||||
| ABIDE_I/CaliforniaInstituteofTechnology/sub-0051475/anat/sub-0051475_T1w.nii.gz | sub-0051475 | 1 | 1 | a2009s | ADULT | lG_Ins_lg_and_S_cent_ins | 3.01e+00 | 3.14e+00 |
| ABIDE_I/CaliforniaInstituteofTechnology/sub-0051475/anat/sub-0051475_T1w.nii.gz | sub-0051475 | 1 | 1 | a2009s | ADULT | lG_and_S_cingul-Ant | 3.11e+00 | 3.02e+00 |
| ABIDE_I/CaliforniaInstituteofTechnology/sub-0051475/anat/sub-0051475_T1w.nii.gz | sub-0051475 | 1 | 1 | a2009s | ADULT | lG_and_S_cingul-Mid-Ant | 2.94e+00 | 2.73e+00 |
| ABIDE_I/CaliforniaInstituteofTechnology/sub-0051475/anat/sub-0051475_T1w.nii.gz | sub-0051475 | 1 | 1 | a2009s | ADULT | lG_and_S_cingul-Mid-Post | 2.73e+00 | 2.60e+00 |
Search subjects with at least one ROI#
#@title
df_rois_nan = df_software.loc[df_software[[('corticalThicknessAverage', 'FREESURFER'), ('corticalThicknessAverage', 'ACPC_CAT12')]].isna().sum(axis=1)>0]
df_rois_nan
| subjectID | sessionID | run | template | adult | roiName | corticalThicknessAverage | ||
|---|---|---|---|---|---|---|---|---|
| software | ACPC_CAT12 | FREESURFER | ||||||
| path | ||||||||
Exclude subjects with at least one ROI#
#@title
df_software_raw = df_software_raw.loc[~df_software_raw.index.isin(df_rois_nan.index.get_level_values(0).to_list())]
df_software = df_software.loc[~df_software.index.isin(df_rois_nan.index.get_level_values(0).to_list())]
Analysis#
Overall Analysis#
Bland-Altman plot#
from IPython.display import display, HTML

for var_value in df_software[var_compare].unique():
    df_soft_filter = df_software.loc[df_software[var_compare] == var_value]
    diff = (df_soft_filter[("corticalThicknessAverage", "FREESURFER")] - df_soft_filter[("corticalThicknessAverage", "ACPC_CAT12")])
    test = pg.ttest(diff, 0)


    df_means_diff = df_soft_filter[[("corticalThicknessAverage", "FREESURFER"),
                                    ("corticalThicknessAverage", "ACPC_CAT12")]].mean().to_frame().T.rename(columns={"corticalThicknessAverage": "Cortical Thickness Average Mean"})
    df_means_diff["Difference FREESURFER - CAT12"] = diff.mean()


    test = pg.ttest(diff, 0)
    display(HTML(f"<br><h5>{var_value}</h5>"))
    display(HTML(df_means_diff.to_html()))

    display(HTML(f"<br><p>One sample t-test to verify whether the means difference is equal to zero</p>"))
    display(HTML(test.to_html()))
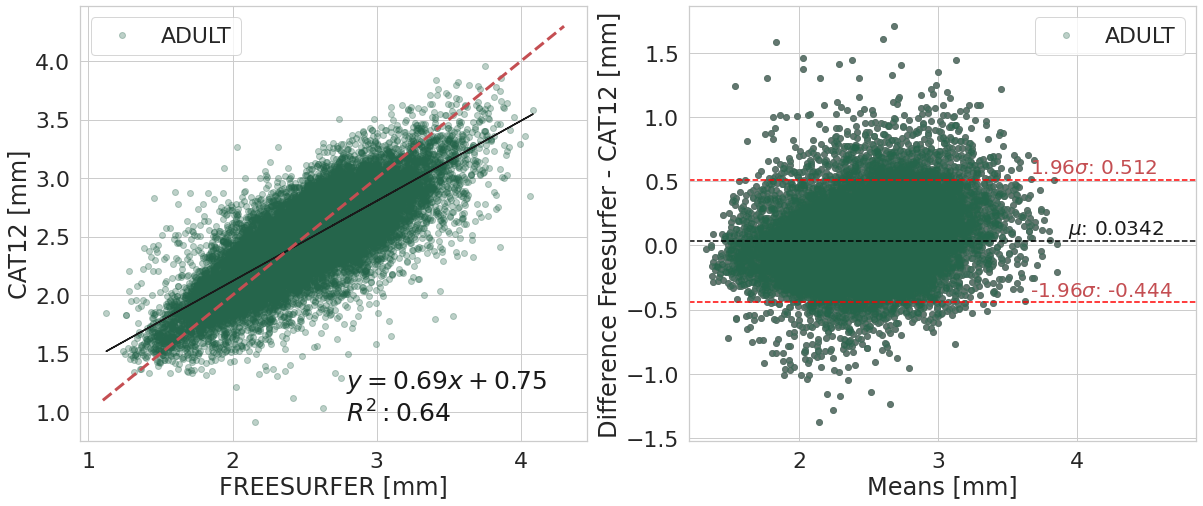
    print(f"Confidence interval (95%) of the means difference: [{round(diff.mean() - 1.96*diff.std(), 3)};{round(diff.mean() + 1.96*diff.std(), 3)}]")
ADULT
| Cortical Thickness Average Mean | Difference FREESURFER - CAT12 | ||
|---|---|---|---|
| software | FREESURFER | ACPC_CAT12 | |
| 0 | 2.49e+00 | 2.45e+00 | 3.42e-02 |
One sample t-test to verify whether the means difference is equal to zero
| T | dof | alternative | p-val | CI95% | cohen-d | BF10 | power | |
|---|---|---|---|---|---|---|---|---|
| T-test | 2.30e+01 | 26935 | two-sided | 3.26e-116 | [0.03, 0.04] | 1.40e-01 | 7.157e+111 | 1.00e+00 |
Confidence interval (95%) of the means difference: [-0.444;0.512]
/home/fmachado/anaconda3/envs/fs-cat12/lib/python3.9/site-packages/pingouin/bayesian.py:146: RuntimeWarning: divide by zero encountered in double_scalars
  bf10 = 1 / ((1 + t**2 / df)**(-(df + 1) / 2) / integr)
/home/fmachado/anaconda3/envs/fs-cat12/lib/python3.9/site-packages/pingouin/bayesian.py:146: RuntimeWarning: divide by zero encountered in double_scalars
  bf10 = 1 / ((1 + t**2 / df)**(-(df + 1) / 2) / integr)
PAEDIATRIC
| Cortical Thickness Average Mean | Difference FREESURFER - CAT12 | ||
|---|---|---|---|
| software | FREESURFER | ACPC_CAT12 | |
| 0 | 2.60e+00 | 2.52e+00 | 8.00e-02 |
One sample t-test to verify whether the means difference is equal to zero
| T | dof | alternative | p-val | CI95% | cohen-d | BF10 | power | |
|---|---|---|---|---|---|---|---|---|
| T-test | 6.47e+01 | 56831 | two-sided | 0.00e+00 | [0.08, 0.08] | 2.71e-01 | inf | 1.00e+00 |
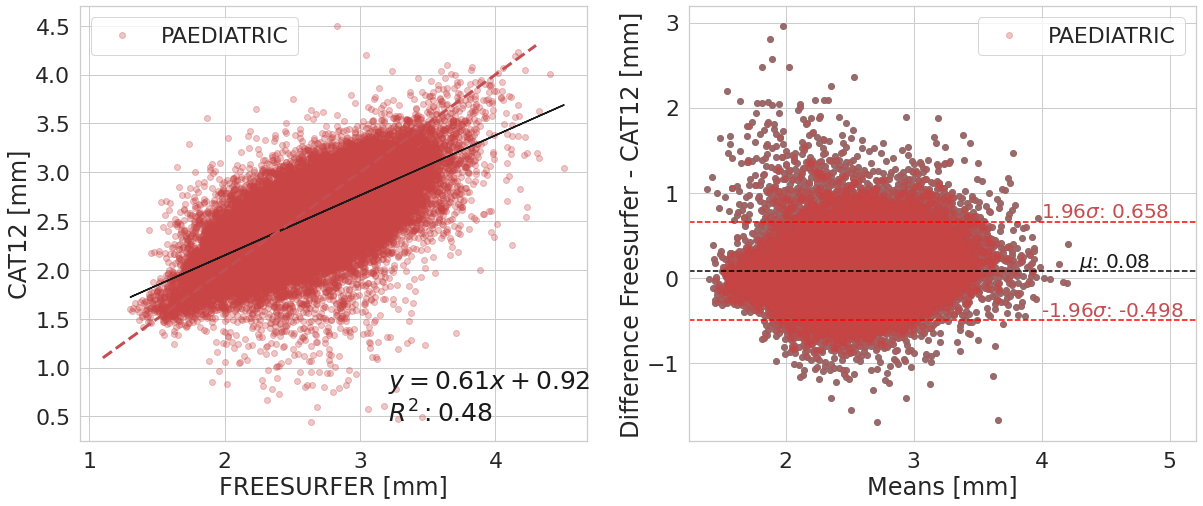
Confidence interval (95%) of the means difference: [-0.498;0.658]
#@title
y_label_txt = "Difference Freesurfer - CAT12 [mm]"

for var in df_software[var_compare].unique():
    df_filt = df_software.loc[df_software[var_compare] == var]
    bland_altman_plot(df_filt.copy().reset_index(),
                      ('corticalThicknessAverage', 'FREESURFER'),
                      ('corticalThicknessAverage', 'ACPC_CAT12'),
                      var_compare, color_pallete, x_label_reg="FREESURFER [mm]", y_label_reg="CAT12 [mm]",
                      y_label_diff="Difference Freesurfer - CAT12 [mm]")


#@title

df = df_software.reset_index().set_index(["subjectID", "sessionID", "run"]).join(df_subjects.reset_index().set_index(["subjectID", "sessionID", "run"]))
df.columns = ["".join(el) for el in df.columns]
df.head(3)
/tmp/ipykernel_42235/928943096.py:3: FutureWarning: merging between different levels is deprecated and will be removed in a future version. (2 levels on the left, 1 on the right)
  df = df_software.reset_index().set_index(["subjectID", "sessionID", "run"]).join(df_subjects.reset_index().set_index(["subjectID", "sessionID", "run"]))
| path | template | adult | roiName | corticalThicknessAverageACPC_CAT12 | corticalThicknessAverageFREESURFER | path | repositoryName | site | adult | repository_and_site | age | gender | snr_total | |||
|---|---|---|---|---|---|---|---|---|---|---|---|---|---|---|---|---|
| subjectID | sessionID | run | ||||||||||||||
| sub-0050030 | 1 | 1 | ABIDE_I/UniversityofPittsburghSchoolofMedicine... | a2009s | ADULT | lG_Ins_lg_and_S_cent_ins | 3.43e+00 | 2.96e+00 | ABIDE_I/UniversityofPittsburghSchoolofMedicine... | ABIDE_I | University of Pittsburgh School of Medicine | ADULT | ABIDE_I|UniversityofPittsburghSchoolofMedicine | 2.51e+01 | MALE | 1.23e+01 |
| 1 | ABIDE_I/UniversityofPittsburghSchoolofMedicine... | a2009s | ADULT | lG_and_S_cingul-Ant | 2.62e+00 | 2.57e+00 | ABIDE_I/UniversityofPittsburghSchoolofMedicine... | ABIDE_I | University of Pittsburgh School of Medicine | ADULT | ABIDE_I|UniversityofPittsburghSchoolofMedicine | 2.51e+01 | MALE | 1.23e+01 | ||
| 1 | ABIDE_I/UniversityofPittsburghSchoolofMedicine... | a2009s | ADULT | lG_and_S_cingul-Mid-Ant | 3.05e+00 | 2.79e+00 | ABIDE_I/UniversityofPittsburghSchoolofMedicine... | ABIDE_I | University of Pittsburgh School of Medicine | ADULT | ABIDE_I|UniversityofPittsburghSchoolofMedicine | 2.51e+01 | MALE | 1.23e+01 |
Participant Analysis#
#@title
print(f'Number of subjects in this analysis is: {len(df_software.reset_index()["subjectID"].unique())}')
Number of subjects in this analysis is: 566
Compute metrics#
#@title

sub_grouped_by, sub_grouped_by_stats = get_regression_metrics(df_software, ['path'], (metric_analysis, pipeline1), (metric_analysis, pipeline2))

df_ct = df_software.reset_index()[["path", var_compare, "roiName", "corticalThicknessAverage"]].melt(id_vars=["path", var_compare, "roiName"])

all_subjects_icc = []

for path_sub in df_ct["path"].unique():
    df_icc_roi = pg.intraclass_corr(data=df_ct.loc[df_ct["path"] == path_sub],
                                    targets='roiName', raters='software',
                                    ratings='value')
    df_icc_roi["path"] = path_sub

    all_subjects_icc.append(df_icc_roi.loc[df_icc_roi["Type"]=="ICC3"])

df_icc_sub = pd.concat(all_subjects_icc).set_index("path")

df_subject_info = df_subjects.reset_index().set_index(['path']).join(sub_grouped_by_stats).join(df_icc_sub[["ICC"]])
df_subject_info = df_subject_info[~df_subject_info["slope"].isna()]

df_subject_info.head(5)
| repositoryName | site | adult | repository_and_site | subjectID | sessionID | run | age | gender | snr_total | slope | intercept | r_value | p_value | std_err | r_square | ICC | |
|---|---|---|---|---|---|---|---|---|---|---|---|---|---|---|---|---|---|
| path | |||||||||||||||||
| ABIDE_I/CaliforniaInstituteofTechnology/sub-0051475/anat/sub-0051475_T1w.nii.gz | ABIDE_I | California Institute of Technology | ADULT | ABIDE_I|CaliforniaInstituteofTechnology | sub-0051475 | 1 | 1 | 4.42e+01 | MALE | 1.52e+01 | 7.74e-01 | 7.09e-01 | 8.12e-01 | 6.82e-36 | 4.61e-02 | 6.59e-01 | 8.11e-01 |
| ABIDE_I/CaliforniaInstituteofTechnology/sub-0051476/anat/sub-0051476_T1w.nii.gz | ABIDE_I | California Institute of Technology | ADULT | ABIDE_I|CaliforniaInstituteofTechnology | sub-0051476 | 1 | 1 | 3.93e+01 | MALE | 1.64e+01 | 9.63e-01 | 2.11e-01 | 8.99e-01 | 4.25e-54 | 3.89e-02 | 8.07e-01 | 8.96e-01 |
| ABIDE_I/CaliforniaInstituteofTechnology/sub-0051477/anat/sub-0051477_T1w.nii.gz | ABIDE_I | California Institute of Technology | ADULT | ABIDE_I|CaliforniaInstituteofTechnology | sub-0051477 | 1 | 1 | 4.25e+01 | MALE | 1.60e+01 | 8.36e-01 | 4.95e-01 | 8.24e-01 | 8.18e-38 | 4.76e-02 | 6.79e-01 | 8.24e-01 |
| ABIDE_I/CaliforniaInstituteofTechnology/sub-0051478/anat/sub-0051478_T1w.nii.gz | ABIDE_I | California Institute of Technology | ADULT | ABIDE_I|CaliforniaInstituteofTechnology | sub-0051478 | 1 | 1 | 1.97e+01 | MALE | 1.56e+01 | 9.04e-01 | 3.54e-01 | 7.86e-01 | 2.85e-32 | 5.89e-02 | 6.17e-01 | 7.78e-01 |
| ABIDE_I/CaliforniaInstituteofTechnology/sub-0051479/anat/sub-0051479_T1w.nii.gz | ABIDE_I | California Institute of Technology | ADULT | ABIDE_I|CaliforniaInstituteofTechnology | sub-0051479 | 1 | 1 | 2.00e+01 | FEMALE | 1.52e+01 | 9.14e-01 | 3.74e-01 | 8.36e-01 | 7.58e-40 | 4.97e-02 | 6.99e-01 | 8.32e-01 |
Reproducibility metrics analysis#
#@title
df_subject_info.groupby(by=var_compare).apply(lambda x: pd.Series([f'{x["ICC"].mean(): 0.2f}+/-{x["ICC"].std(): 0.2f}',
                                                                   f'{x["r_square"].mean(): 0.2f}+/-{x["r_square"].std(): 0.2f}'],
                                                                   index=['ICC', '$R^2$']))
| ICC | $R^2$ | |
|---|---|---|
| adult | ||
| ADULT | 0.79+/- 0.06 | 0.64+/- 0.09 |
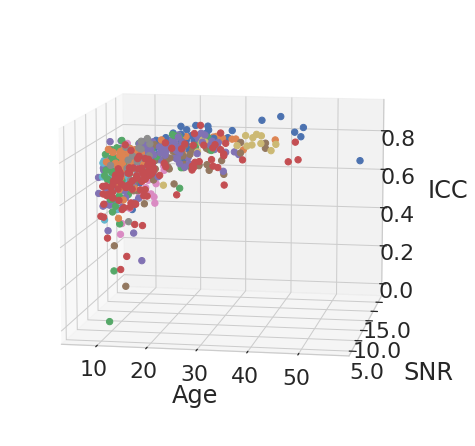
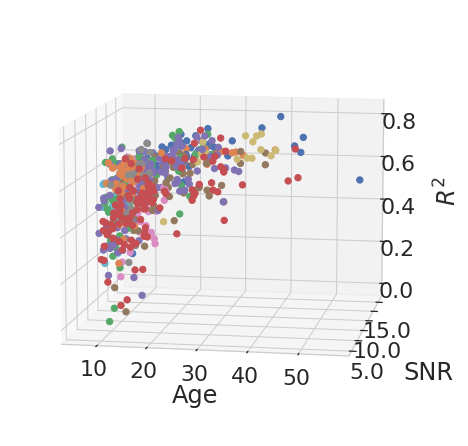
| PAEDIATRIC | 0.69+/- 0.11 | 0.51+/- 0.14 |
Analysis of age effect on reproducibility metrics#
def latex_float(float_str):

    if "e" in float_str:
        base, exponent = float_str.split("e")
        return r"{0} \times 10^{{{1}}}".format(base, int(exponent))
    else:
        return float_str
import re, seaborn as sns
import numpy as np

from matplotlib import pyplot as plt
from mpl_toolkits.mplot3d import Axes3D
from matplotlib.colors import ListedColormap
from IPython.display import display, Math


reproducibility_measures = [("ICC", "ICC"), ("r_square", "$R^2$")]

for rep_measure, label_measure in reproducibility_measures:

    for el in df_subject_info[var_compare].unique():
        legend = el

        data_filtered = df_subject_info.loc[df_subject_info[var_compare] == el]

        x_values = data_filtered[["age", "snr_total"]]
        y_values = data_filtered[rep_measure]

        model = LinearRegression().fit(x_values, y_values)


        age_weight = latex_float(f'{model.coef_[0]: 0.1e}')
        SNR_weight = latex_float(f'{model.coef_[1]: 0.1e}')
        intercept = latex_float(f'{model.intercept_: 0.1e}')

        eq = f'${label_measure.replace("$", "")}_' + "{" + legend + "}" + f'={age_weight}age + {SNR_weight}SNR + {intercept}$'
        display(Math(r'{}'.format(eq)))

    fig = plt.figure(figsize=(6,6))
    ax = Axes3D(fig, auto_add_to_figure=False)
    fig.add_axes(ax)


    for el in df_subject_info["site"].unique():

        df_filt = df_subject_info.loc[df_subject_info["site"] == el]
        x= df_filt["age"].values
        y= df_filt["snr_total"].values
        z= df_filt[rep_measure].values
        # axes instance

        # get colormap from seaborn
        cmap = ListedColormap(sns.color_palette("husl", 256).as_hex())

        # plot
        sc = ax.scatter(x, y, z, s=40, marker='o', cmap=cmap, alpha=1)

    ax.set_xlabel('Age', labelpad=15)
    ax.set_ylabel('SNR', labelpad=30)
    ax.set_zlabel(label_measure, labelpad=30)

    for label in ax.get_yaxis().get_ticklabels()[::2]:
        label.set_visible(False)
    ax.view_init(elev=10., azim=-80)

    plt.subplots_adjust(bottom=0.2, top=2)
    plt.setp(ax.get_yticklabels(), rotation=0)

    plt.show()


ROI Analysis#
#@title
roi_grouped_by, roi_grouped_by_stats = get_regression_metrics(df_software, ["roiName", var_compare], (metric_analysis, pipeline1), (metric_analysis, pipeline2))

all_rois = []

for var in df_ct[var_compare].unique():
    for roi_name in df_ct["roiName"].unique():
        df_icc_roi = pg.intraclass_corr(data=df_ct.loc[(df_ct["roiName"] == roi_name) & (df_ct[var_compare] == var)],
                                        targets='path', raters='software',
                                        ratings='value')
        df_icc_roi["roiName"] = roi_name
        df_icc_roi[var_compare] = var

        all_rois.append(df_icc_roi.loc[df_icc_roi["Type"]=="ICC3"])

df_icc_rois = pd.concat(all_rois)


roi_grouped_by_stats = roi_grouped_by_stats.join(pd.concat(all_rois).set_index(["roiName", var_compare])[["ICC", "CI95%"]])


map_abbrev_to_name = df_names_rois.set_index("label")[["name"]].to_dict("series")["name"]
hem_label = {"r": "Right", "l": "Left"}

roi_grouped_by_stats["name"] = roi_grouped_by_stats.index.to_frame().roiName.apply(lambda x: map_abbrev_to_name[x[1:]])
roi_grouped_by_stats["hem"] = roi_grouped_by_stats.index.to_frame().roiName.apply(lambda x: hem_label[x[0].lower()])


dfs = []

rois_info = roi_grouped_by_stats.copy()
rois_info["label"] = roi_grouped_by_stats.index.get_level_values(0).str[1:].str.strip()
rois_info["hem"] = roi_grouped_by_stats.index.get_level_values(0).str[0]
rois_info = rois_info.reset_index().set_index(["label", "hem", var_compare])

for var in rois_info.index.get_level_values(2).unique():
    for hem in rois_info.index.get_level_values(1).unique():
        df_areas_metrics_var = pd.concat([df_areas, df_areas["Label"].apply(lambda x: rois_info.loc[(x, hem, var)])], axis=1)
        df_areas_metrics_var[var_compare] = var
        dfs.append(df_areas_metrics_var)

df_areas_metrics = pd.concat(dfs)
df_areas_metrics["hem"] = df_areas_metrics["roiName"].str[0]


df_icc = df_areas_metrics.pivot_table(index="name", columns=[var_compare, "hem"], values=["ICC"])

df_ci = df_areas_metrics.pivot_table(index="name", columns=[var_compare, "hem"], values=["CI95%"])

df_ci_icc = df_icc.join(df_ci)
df_ci_icc.columns = df_ci_icc.columns.swaplevel(0, 2)
df_ci_icc.columns = df_ci_icc.columns.swaplevel(0, 1)
df_ci_icc = df_ci_icc[[df_ci_icc.columns[0], df_ci_icc.columns[-4],
                     df_ci_icc.columns[1], df_ci_icc.columns[-3],
                     df_ci_icc.columns[2], df_ci_icc.columns[-2],
                     df_ci_icc.columns[3], df_ci_icc.columns[-1]]]

roi_grouped_by_stats
| slope | intercept | r_value | p_value | std_err | r_square | ICC | CI95% | name | hem | ||
|---|---|---|---|---|---|---|---|---|---|---|---|
| roiName | adult | ||||||||||
| lG_Ins_lg_and_S_cent_ins | ADULT | 4.62e-01 | 1.68e+00 | 5.13e-01 | 1.34e-13 | 5.77e-02 | 2.63e-01 | 5.10e-01 | [0.39, 0.61] | Long insular gyrus and central sulcus of the i... | Left |
| PAEDIATRIC | 2.59e-01 | 2.34e+00 | 4.21e-01 | 6.50e-18 | 2.86e-02 | 1.77e-01 | 3.76e-01 | [0.29, 0.46] | Long insular gyrus and central sulcus of the i... | Left | |
| lG_and_S_cingul-Ant | ADULT | 4.65e-01 | 1.46e+00 | 5.08e-01 | 2.36e-13 | 5.88e-02 | 2.58e-01 | 5.06e-01 | [0.39, 0.61] | Anterior part of the cingulate gyrus and sulcus | Left |
| PAEDIATRIC | 4.36e-01 | 1.60e+00 | 4.16e-01 | 1.64e-17 | 4.88e-02 | 1.73e-01 | 4.16e-01 | [0.33, 0.5] | Anterior part of the cingulate gyrus and sulcus | Left | |
| lG_and_S_cingul-Mid-Ant | ADULT | 6.04e-01 | 9.65e-01 | 6.61e-01 | 3.11e-24 | 5.11e-02 | 4.37e-01 | 6.58e-01 | [0.57, 0.73] | Middle-anterior part of the cingulate gyrus an... | Left |
| ... | ... | ... | ... | ... | ... | ... | ... | ... | ... | ... | ... |
| rS_temporal_inf | PAEDIATRIC | 5.48e-01 | 1.12e+00 | 3.89e-01 | 2.54e-15 | 6.64e-02 | 1.51e-01 | 3.67e-01 | [0.28, 0.45] | Inferior temporal sulcus | Right |
| rS_temporal_sup | ADULT | 7.52e-01 | 5.71e-01 | 7.86e-01 | 1.99e-39 | 4.41e-02 | 6.18e-01 | 7.85e-01 | [0.72, 0.84] | Superior temporal sulcus | Right |
| PAEDIATRIC | 6.82e-01 | 8.02e-01 | 6.52e-01 | 7.49e-48 | 4.06e-02 | 4.25e-01 | 6.51e-01 | [0.59, 0.71] | Superior temporal sulcus | Right | |
| rS_temporal_transverse | ADULT | 8.75e-01 | 4.57e-01 | 6.37e-01 | 4.40e-22 | 7.90e-02 | 4.05e-01 | 6.06e-01 | [0.51, 0.69] | Transverse temporal sulcus | Right |
| PAEDIATRIC | 3.11e-01 | 1.88e+00 | 3.06e-01 | 8.60e-10 | 4.95e-02 | 9.39e-02 | 3.06e-01 | [0.21, 0.39] | Transverse temporal sulcus | Right |
296 rows × 10 columns
#@title
df_sorted = pd.pivot_table(roi_grouped_by_stats.reset_index(), index="name", values=["r_square"], columns=[var_compare, "hem"])
df_sorted
| r_square | ||||
|---|---|---|---|---|
| adult | ADULT | PAEDIATRIC | ||
| hem | Left | Right | Left | Right |
| name | ||||
| Angular gyrus | 3.56e-01 | 4.28e-01 | 3.94e-01 | 4.06e-01 |
| Anterior occipital sulcus and preoccipital notch | 4.29e-01 | 4.40e-01 | 2.98e-01 | 2.61e-01 |
| Anterior part of the cingulate gyrus and sulcus | 2.58e-01 | 1.50e-01 | 1.73e-01 | 1.60e-01 |
| Anterior segment of the circular sulcus of the insula | 9.09e-02 | 1.62e-01 | 1.85e-01 | 1.25e-01 |
| Anterior transverse collateral sulcus | 6.69e-02 | 6.02e-02 | 1.67e-02 | 7.26e-02 |
| ... | ... | ... | ... | ... |
| Temporal pole | 3.04e-01 | 2.76e-01 | 4.37e-01 | 5.09e-01 |
| Transverse frontopolar gyri and sulci | 3.84e-01 | 4.27e-01 | 3.06e-01 | 2.96e-01 |
| Transverse temporal sulcus | 4.81e-01 | 4.05e-01 | 3.32e-01 | 9.39e-02 |
| Triangular part of the inferior frontal gyrus | 3.83e-01 | 3.92e-01 | 3.82e-01 | 2.76e-01 |
| Vertical ramus of the anterior segment of the lateral sulcus | 1.62e-01 | 1.22e-01 | 1.47e-01 | 1.29e-01 |
74 rows × 4 columns
Reproducibility metrics analysis#
#@title
roi_grouped_by_stats.groupby(by=var_compare).apply(lambda x: pd.Series([f'{x["ICC"].mean(): 0.2f}+/-{x["ICC"].std(): 0.2f}',
                                                                        f'{x["r_square"].mean(): 0.2f}+/-{x["r_square"].std(): 0.2f}'],
                                                                        index=['ICC', '$R^2$']))
| ICC | $R^2$ | |
|---|---|---|
| adult | ||
| ADULT | 0.59+/- 0.15 | 0.38+/- 0.16 |
| PAEDIATRIC | 0.52+/- 0.14 | 0.30+/- 0.14 |
df_roi_t = roi_grouped_by_stats.reset_index()

for var in ["r_square","ICC"]:

    df_result = pg.ttest(df_roi_t.loc[df_roi_t[var_compare] == "PAEDIATRIC"][var],
                         df_roi_t.loc[df_roi_t[var_compare] == "ADULT"][var])

    display(HTML(f"<br><h5>{var}</h5>"))
    display(HTML(df_result.to_html()))
r_square
| T | dof | alternative | p-val | CI95% | cohen-d | BF10 | power | |
|---|---|---|---|---|---|---|---|---|
| T-test | -4.79e+00 | 294 | two-sided | 2.59e-06 | [-0.12, -0.05] | 5.57e-01 | 5415.382 | 9.98e-01 |
ICC
| T | dof | alternative | p-val | CI95% | cohen-d | BF10 | power | |
|---|---|---|---|---|---|---|---|---|
| T-test | -3.98e+00 | 294 | two-sided | 8.78e-05 | [-0.1, -0.03] | 4.62e-01 | 209.663 | 9.77e-01 |
Mean per lobe#
#@title

to_group_by = ["Area"]
df_areas_metrics_grouped = df_areas_metrics.groupby(to_group_by + [var_compare, "hem"]).mean()
df_lobes = pd.pivot_table(df_areas_metrics_grouped.reset_index(), index=to_group_by, values=["r_square"], columns=[var_compare])

df_lobes
| r_square | ||
|---|---|---|
| adult | ADULT | PAEDIATRIC |
| Area | ||
| Frontal Lobe | 3.47e-01 | 2.82e-01 |
| Insula | 2.42e-01 | 1.58e-01 |
| Limbic lobe | 3.65e-01 | 2.69e-01 |
| Parietal lobe | 4.91e-01 | 4.07e-01 |
| Temporal and occipital lobes | 4.14e-01 | 3.08e-01 |
Paired t-test#
all_df = []
for var in df_ct[var_compare].unique():
    for roiname in df_ct['roiName'].unique():
        df_posthoc = pg.pairwise_ttests(data=df_ct.loc[(df_ct['roiName'] == roiname) & (df_ct[var_compare] == var)],
                                        dv='value', within='software', subject='path',
                                     parametric=True, padjust='fdr_bh', effsize='cohen')

        # Pretty printing of table
        df_posthoc['roiName'] = roiname
        df_posthoc[var_compare] = var
        all_df.append(df_posthoc)
df_f_p_value = pd.concat(all_df)
df_f_p_value.head(4)
| Contrast | A | B | Paired | Parametric | T | dof | alternative | p-unc | BF10 | cohen | roiName | adult | |
|---|---|---|---|---|---|---|---|---|---|---|---|---|---|
| 0 | software | ACPC_CAT12 | FREESURFER | True | True | -5.27e+00 | 1.81e+02 | two-sided | 3.87e-07 | 2.789e+04 | -3.87e-01 | lG_Ins_lg_and_S_cent_ins | ADULT |
| 0 | software | ACPC_CAT12 | FREESURFER | True | True | -2.17e+00 | 1.81e+02 | two-sided | 3.16e-02 | 0.81 | -1.60e-01 | lG_and_S_cingul-Ant | ADULT |
| 0 | software | ACPC_CAT12 | FREESURFER | True | True | 1.21e+01 | 1.81e+02 | two-sided | 4.82e-25 | 7.93e+21 | 7.41e-01 | lG_and_S_cingul-Mid-Ant | ADULT |
| 0 | software | ACPC_CAT12 | FREESURFER | True | True | 3.18e+00 | 1.81e+02 | two-sided | 1.73e-03 | 10.574 | 1.59e-01 | lG_and_S_cingul-Mid-Post | ADULT |
df_f_p_value["hem"] = df_f_p_value.apply(lambda x: hem_label[x.roiName[0].lower()], axis=1)
df_f_p_value["name"] = df_f_p_value.apply(lambda x: map_abbrev_to_name[x.roiName[1:]], axis=1)

# Bonferroni correction
significance_level = .05

df_f_p_value["p-value"] = df_f_p_value["p-unc"].apply(lambda x: min(x*df_f_p_value.shape[0], 1))
df_f_p_value_rejected = df_f_p_value[df_f_p_value["p-value"] < significance_level]

df_f_p_value["cohen"] = df_f_p_value["cohen"].astype(float).round(2).abs()
df_f_p_value["cohen-p-value"] = df_f_p_value[["p-value", "cohen"]].apply(lambda x: f'{x["cohen"]}*' if x['p-value'] < significance_level else f'{x["cohen"]}', axis=1).astype(str)


df_p_value = pd.pivot_table(df_f_p_value.reset_index(), index="name", values=["cohen-p-value"], columns=[var_compare, "hem"], aggfunc=lambda x: ' '.join(x))
df_p_value
| cohen-p-value | ||||
|---|---|---|---|---|
| adult | ADULT | PAEDIATRIC | ||
| hem | Left | Right | Left | Right |
| name | ||||
| Angular gyrus | 0.45* | 0.73* | 0.85* | 0.9* |
| Anterior occipital sulcus and preoccipital notch | 0.08 | 0.02 | 0.04 | 0.06 |
| Anterior part of the cingulate gyrus and sulcus | 0.16 | 0.2 | 0.34* | 0.14 |
| Anterior segment of the circular sulcus of the insula | 0.08 | 0.17 | 0.09 | 0.45* |
| Anterior transverse collateral sulcus | 0.28 | 0.38* | 0.45* | 0.48* |
| ... | ... | ... | ... | ... |
| Temporal pole | 0.9* | 0.93* | 0.75* | 0.74* |
| Transverse frontopolar gyri and sulci | 0.68* | 0.49* | 1.0* | 0.74* |
| Transverse temporal sulcus | 0.26* | 0.52* | 0.56* | 0.82* |
| Triangular part of the inferior frontal gyrus | 0.56* | 0.38* | 1.02* | 0.76* |
| Vertical ramus of the anterior segment of the lateral sulcus | 0.9* | 0.45* | 0.55* | 0.16 |
74 rows × 4 columns
#@title
print(f"Number of ROIs with at least on group that rejected the paired t-test hypothesis: {df_f_p_value_rejected.reset_index().roiName.unique().shape[0]}")
Number of ROIs with at least on group that rejected the paired t-test hypothesis: 137
Number of regions per site in which the hypothesis was rejected#
#@title
df_f_p_value_rejected.reset_index().groupby(var_compare).count()[["name"]]
| name | |
|---|---|
| adult | |
| ADULT | 109 |
| PAEDIATRIC | 130 |

