Analysis of the Error per Age Bin
Analysis of the Error per Age Bin
import os
import math
import pandas as pd
import seaborn as sns
import matplotlib.pyplot as plt
from pathlib import Path

path_files_test = os.path.join('..', '..', '..', 'resources')

all_data = []
for path in Path(path_files_test).glob("*test.csv"):
    if "gm_wm" in path.name:
        continue
    df_mod = pd.read_csv(path)
    df_mod["modality"] = "+".join(path.name.split("_")[:-1]).upper()
    all_data.append(df_mod)
df = pd.concat(all_data)
df.head(4)
| subjectID | gender | age | y_hat | modality | |
|---|---|---|---|---|---|
| 0 | sub-474 | 1 | 34.01 | 40.339008 | DF+GM |
| 1 | sub-292 | 1 | 23.73 | 31.652921 | DF+GM |
| 2 | sub-382 | 1 | 65.91 | 46.452941 | DF+GM |
| 3 | sub-434 | 1 | 67.24 | 56.620143 | DF+GM |
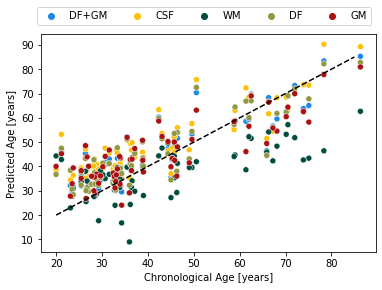
colors = ["#1E88E5", "#FFC107", "#004D40","#909842", "#AB1111"]
sns.scatterplot(x="age", y="y_hat", hue="modality", data=df,
            palette=colors)
plt.plot([20, 85], [20, 85], 'k--')
plt.xlabel("Chronological Age [years]")
plt.ylabel("Predicted Age [years]")
plt.legend(ncol=5, bbox_to_anchor=(1, 1.15))
plt.savefig(f"predicted_age_vs_age.png")
df["age_bin"] = df["age"].round(1).apply(lambda x: math.floor(x/10)*10)#.groupby("age")
df["age_bin"] = df["age_bin"] - (df["age_bin"]==80).astype(int)*10
df_plot_metrics = df.groupby(["age_bin", "modality"]).apply(lambda x: pd.Series([x["age"].mean(), x["y_hat"].mean(), x["y_hat"].std()],
index=["age_mean", "y_hat_mean", "y_hat_std"])).reset_index()
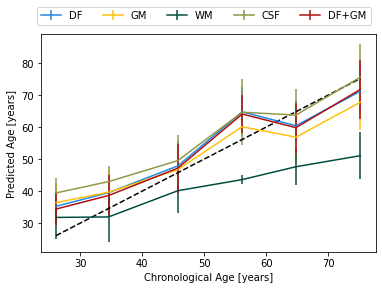
for i, mod in enumerate(["DF", "GM", "WM", "CSF", "DF+GM"]):
df_mod = df_plot_metrics.loc[df_plot_metrics.modality==mod]
plt.errorbar(df_mod["age_mean"], df_mod["y_hat_mean"], yerr=df_mod["y_hat_std"],
label=mod, color=colors[i])
plt.plot([df_plot_metrics["age_mean"].min(), df_plot_metrics["age_mean"].max()], [df_plot_metrics["age_mean"].min(),
df_plot_metrics["age_mean"].max()], 'k--')
plt.xlabel("Chronological Age [years]")
plt.ylabel("Predicted Age [years]")
plt.legend(ncol=5, bbox_to_anchor=(1, 1.15))
<matplotlib.legend.Legend at 0x7fc532eded00>
df_groups = df.groupby(["modality", "age_bin"]).mean()[["age", "y_hat"]].round(2).reset_index()

df_groups["Difference [years]"] = (df_groups["age"] - df_groups["y_hat"]).round(2)
df_groups.rename(columns={"y_hat": "Mean predictions [years]", "age": "Mean age [years]",
                          "age_bin": "Age bin"}, inplace=True)

for el in df_groups.modality.unique():
    print(f"\n##########################            {el}            ##########################\n")
    print(df_groups.loc[df_groups.modality==el].loc[:, df_groups.columns!="modality"])
    print("\n")
##########################            CSF            ##########################

   Age bin  Mean age [years]  Mean predictions [years]  Difference [years]
0       20             26.09                     39.43              -13.34
1       30             34.56                     42.96               -8.40
2       40             45.74                     49.52               -3.78
3       50             56.12                     64.64               -8.52
4       60             64.79                     63.75                1.04
5       70             75.19                     75.59               -0.40


##########################            DF            ##########################

    Age bin  Mean age [years]  Mean predictions [years]  Difference [years]
6        20             26.09                     35.23               -9.14
7        30             34.56                     39.52               -4.96
8        40             45.74                     47.86               -2.12
9        50             56.12                     64.74               -8.62
10       60             64.79                     60.42                4.37
11       70             75.19                     71.20                3.99


##########################            DF+GM            ##########################

    Age bin  Mean age [years]  Mean predictions [years]  Difference [years]
12       20             26.09                     34.39               -8.30
13       30             34.56                     38.62               -4.06
14       40             45.74                     47.17               -1.43
15       50             56.12                     64.06               -7.94
16       60             64.79                     59.82                4.97
17       70             75.19                     71.77                3.42


##########################            GM            ##########################

    Age bin  Mean age [years]  Mean predictions [years]  Difference [years]
18       20             26.09                     36.38              -10.29
19       30             34.56                     39.66               -5.10
20       40             45.74                     46.70               -0.96
21       50             56.12                     60.09               -3.97
22       60             64.79                     56.84                7.95
23       70             75.19                     67.77                7.42


##########################            WM            ##########################

    Age bin  Mean age [years]  Mean predictions [years]  Difference [years]
24       20             26.09                     31.78               -5.69
25       30             34.56                     31.93                2.63
26       40             45.74                     40.12                5.62
27       50             56.12                     43.59               12.53
28       60             64.79                     47.60               17.19
29       70             75.19                     51.07               24.12